LV-Sensors are also designed to be a research tool for researchers and scientists. In order to make this possible the system was developed to be an open platform. This means that 3rd party developers can easily gain access to real-time measurements and develop their own algorithms and applications on the system. Using the LV-Sensors as an open platform gives researchers real access to grid data and real-time measurements, where they can benefit from experimentation and develop realistic applications that can be deployed much faster compared to algorithms based on simulation models where a translation from simulation models to a real working applications is still required. To realize the open platform concept, SST chose embedded Linux (Armbian distribution) as operating system and developed a real-time DSP framework that utilizes the open source messaging system ZeroMQ.
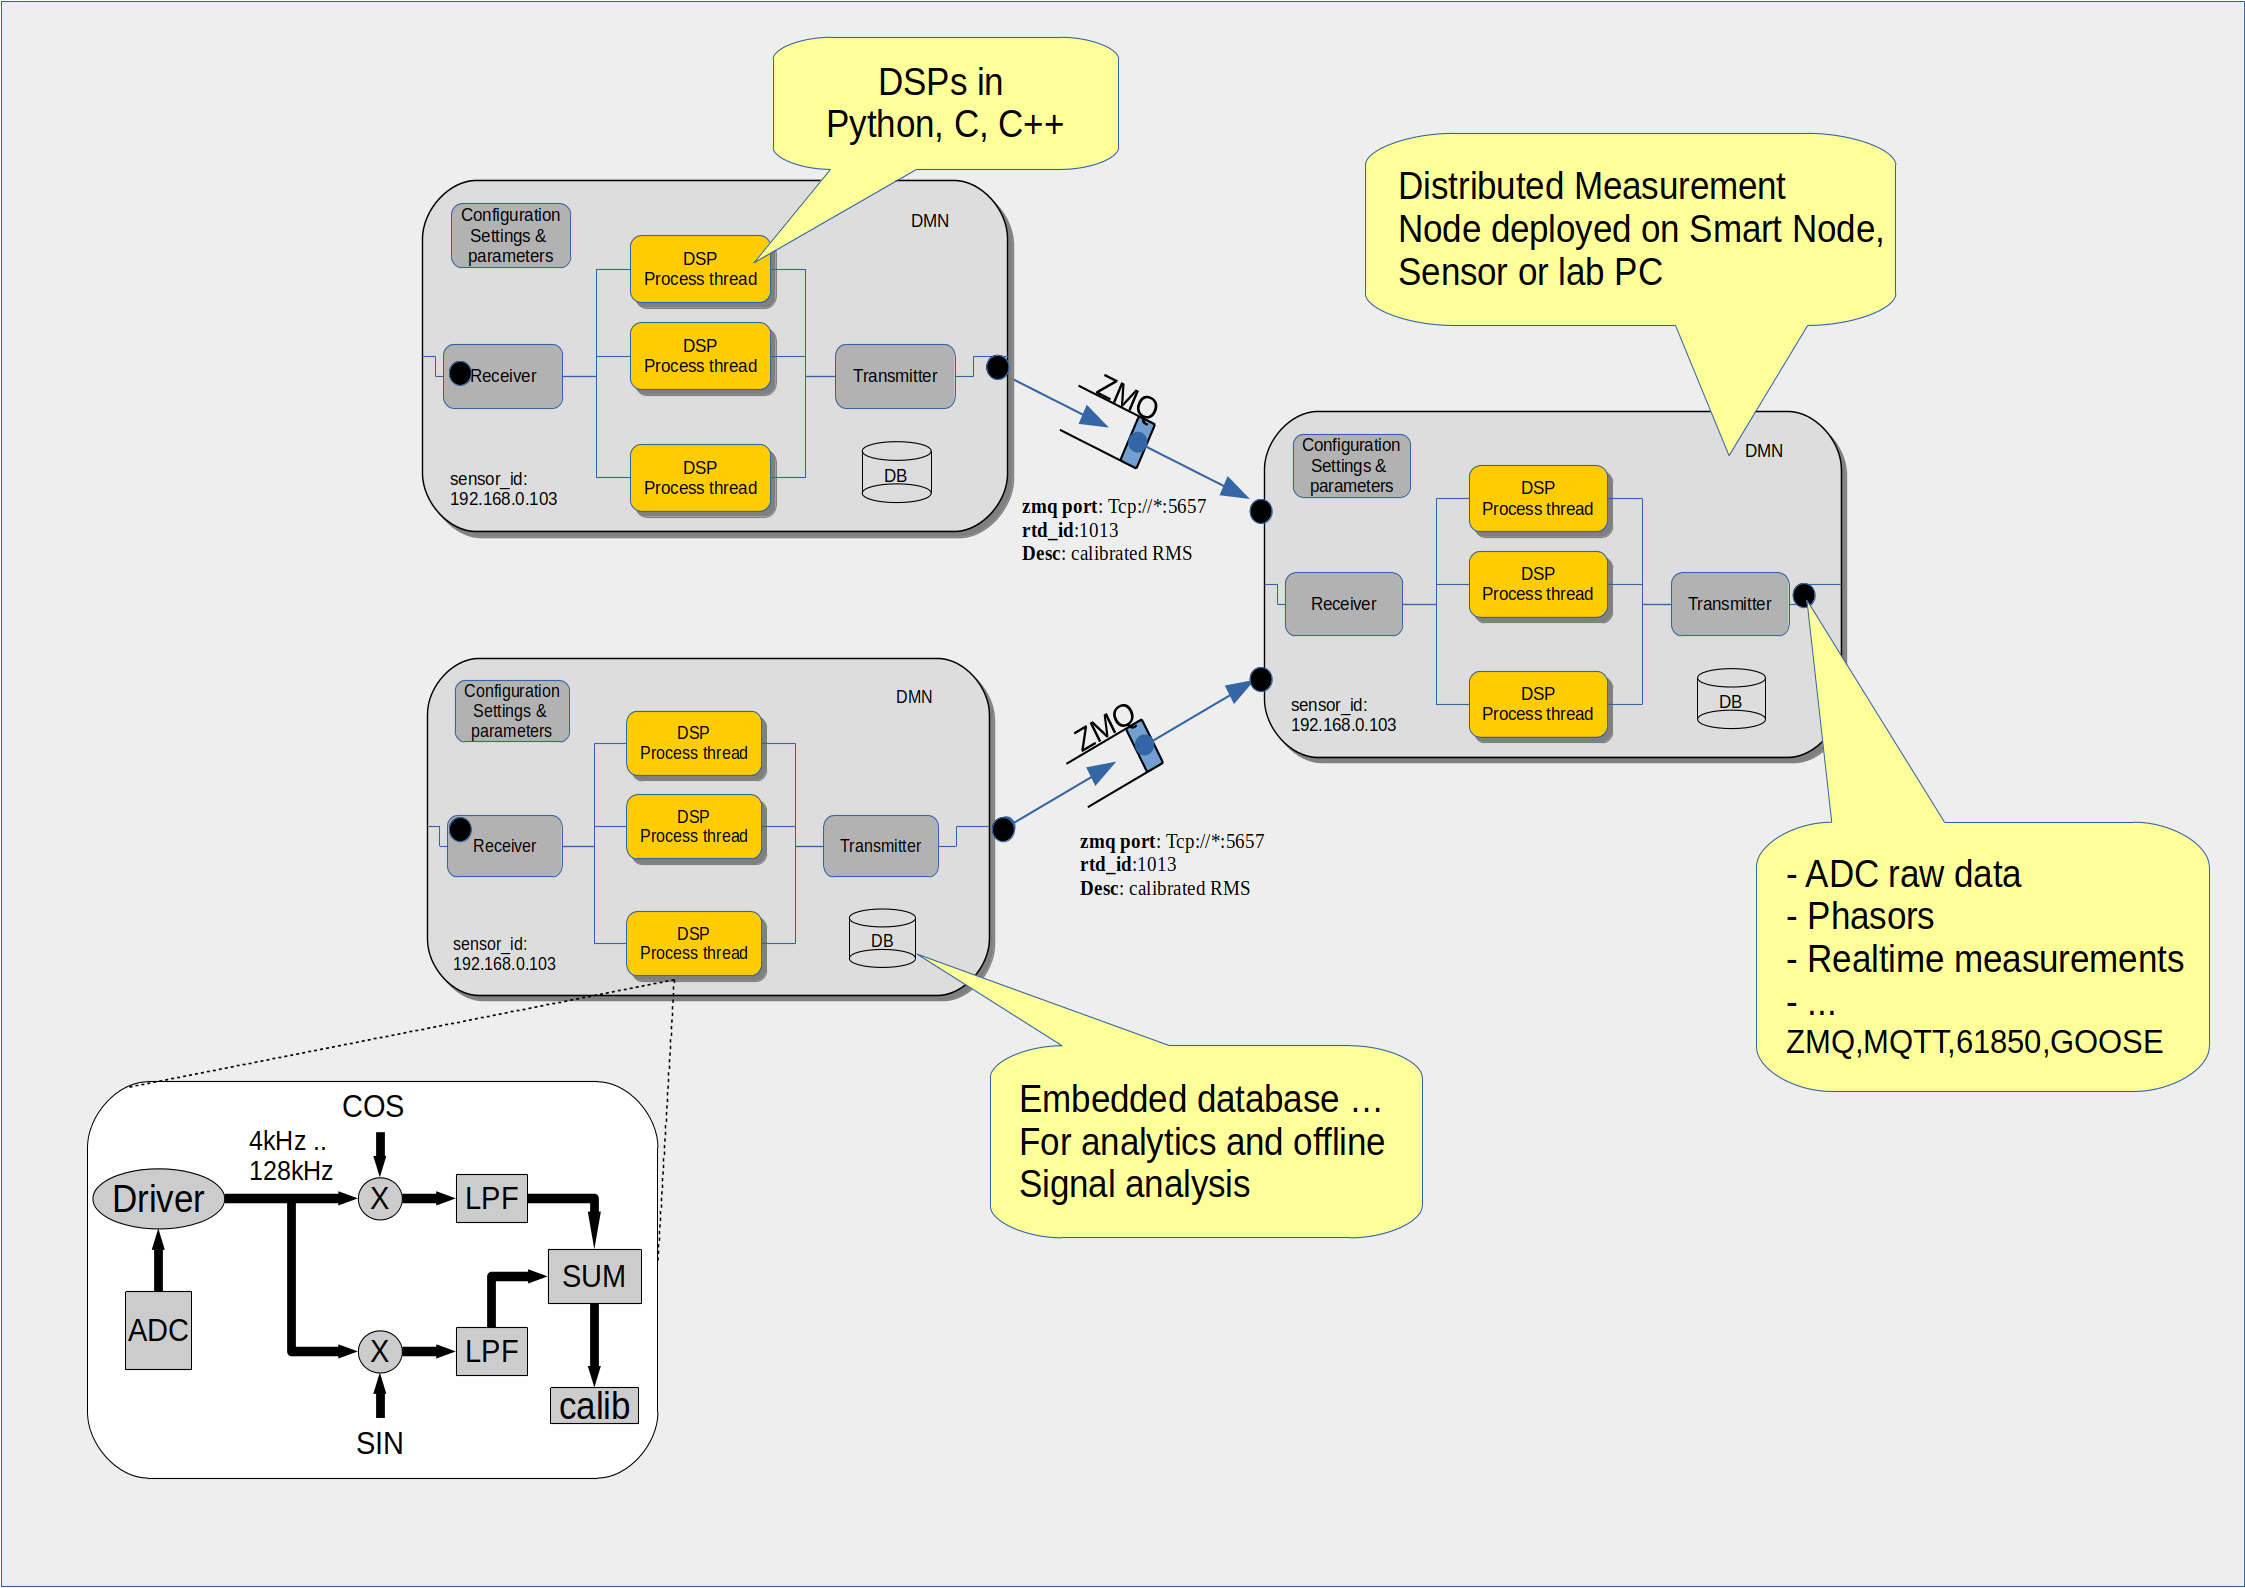
The DSP framework ensures that real-time data, measurements, signal events and application results can easily be exchanged between various sensors and smart nodes at different grid locations as well as between various algorithms (in different programming languages like C++ and Python) running on a single sensor or different threads running within a single process; all in a uniform programming fashion.
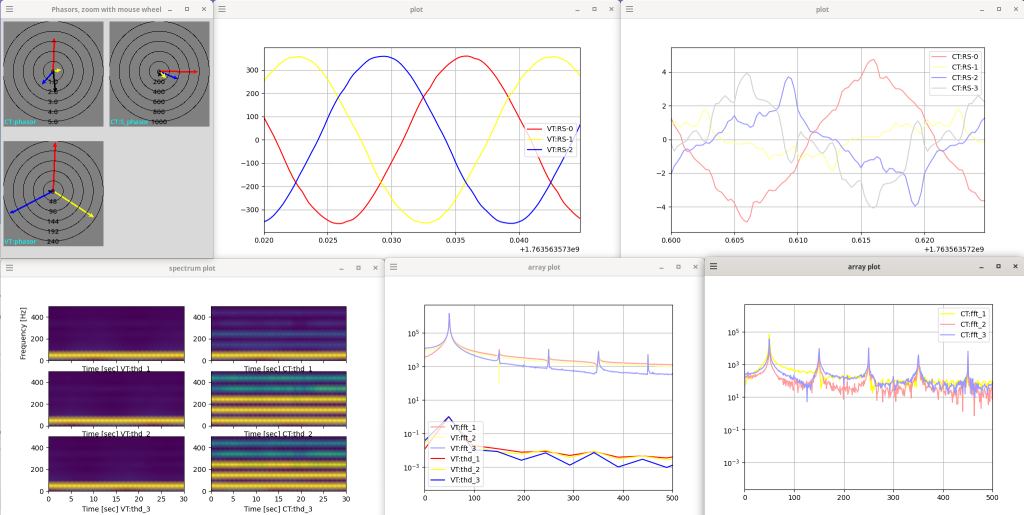
The sensors offer a rich set of basic measurements (U,I,P,Q,Freq) which are available for direct inspection and can easily be used as input to advanced algorithms and/or local/external databases for analytics. We created a number of python scripts to analyse the signals in real time, see the figure below with phasors, voltage/current signals, harmonics spectrum, and FFTs. One of these scripts stores measurements of any DSP in influxdb such that they can visualized with web dashboards such as Grafana.
The dashboard below gives an overview of the electrical network in our lab house with tri-phase, single-phase inverters and household loads. It shows realtime updates power flows updates from influxdb (using the flow panel), additionally it shows historical current/voltage and power over time on the right, e.g. 1 second averages. From this dashboard you can dive into a more detailed view of the voltage, current and power.
The more detailed dashboard shows realtime phasors, time and frequency signals for the selected sensor.
- RMS voltage or current, and active power for last 3 seconds
- phasors for voltage or current, and power (L1: red, L2: yellow, L3: blue)
- raw measured AC voltage or current synchronized to GPS
- the frequency response upto 500Hz